RF Industries Reports Third Quarter Fiscal Year 2026 Financial Results

SAN DIEGO, CA / ACCESS Newswire / September 14, 2026 / RF Industries, Ltd. (NASDAQ:RFIL), a national manufacturer and marketer of interconnect products and systems, today announced financial results for the third quarter of fiscal year 2026 ended July 31, 2026.
Third Quarter Fiscal 2026 Highlights and Operating Results:
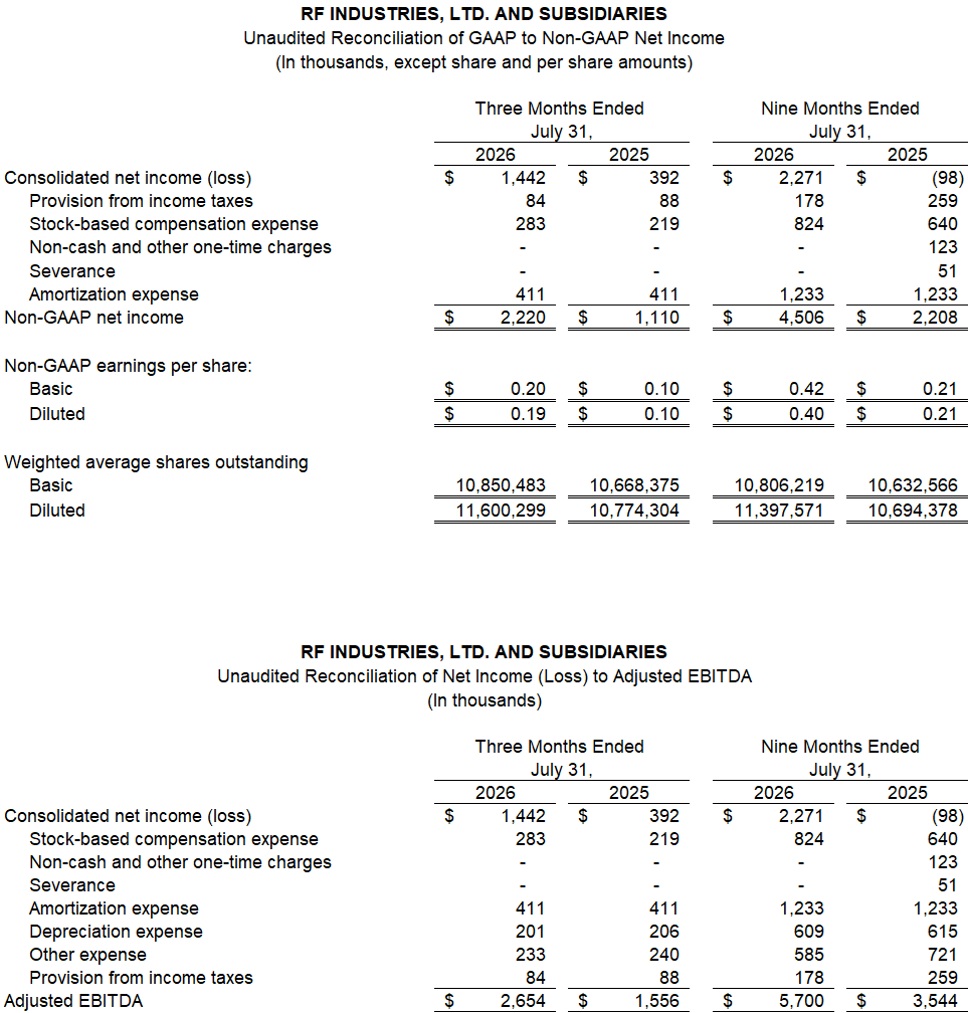
See "Note Regarding Use of Non-GAAP Financial Measures," "Unaudited Reconciliation of GAAP to non-GAAP Net Income," "Unaudited Reconciliation of Net Income (Loss) to Adjusted EBITDA" and the description of bookings and backlog below for additional information.
Management Commentary
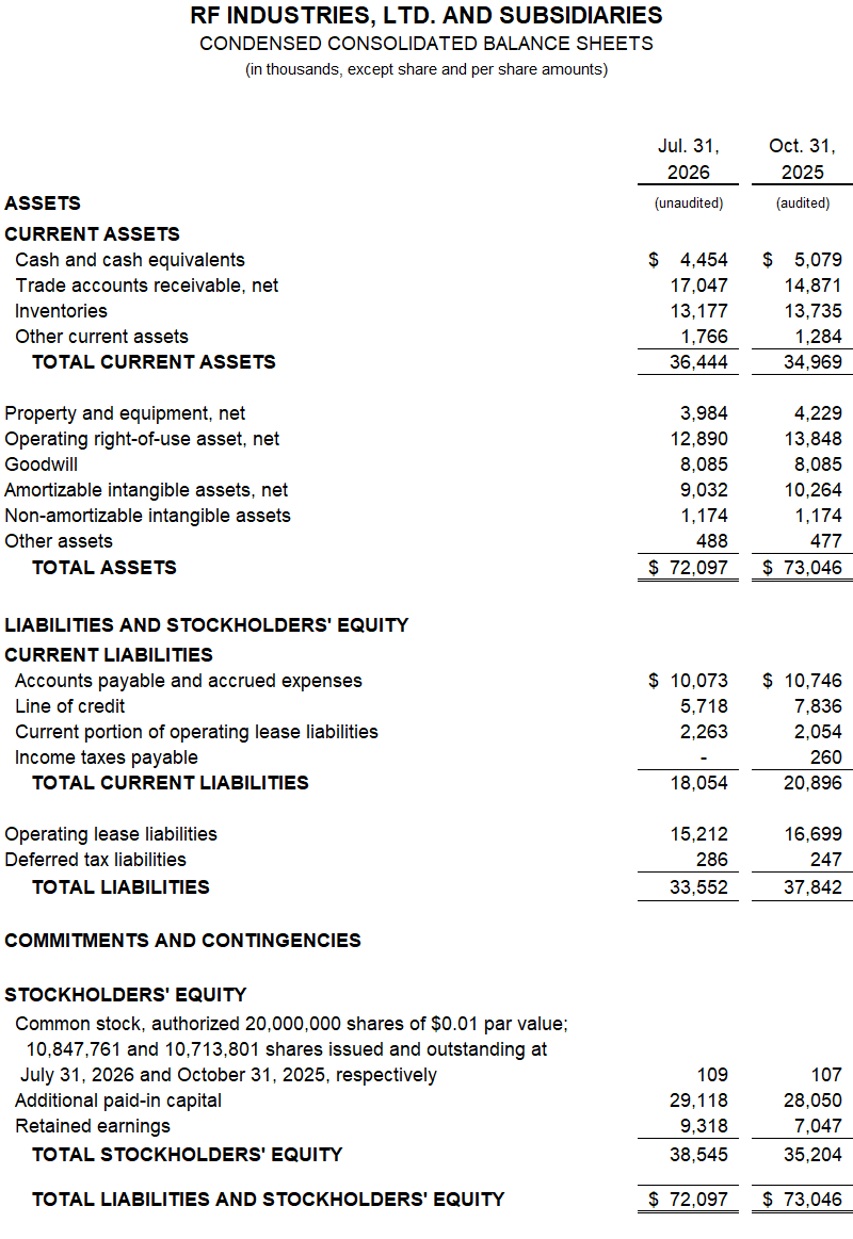
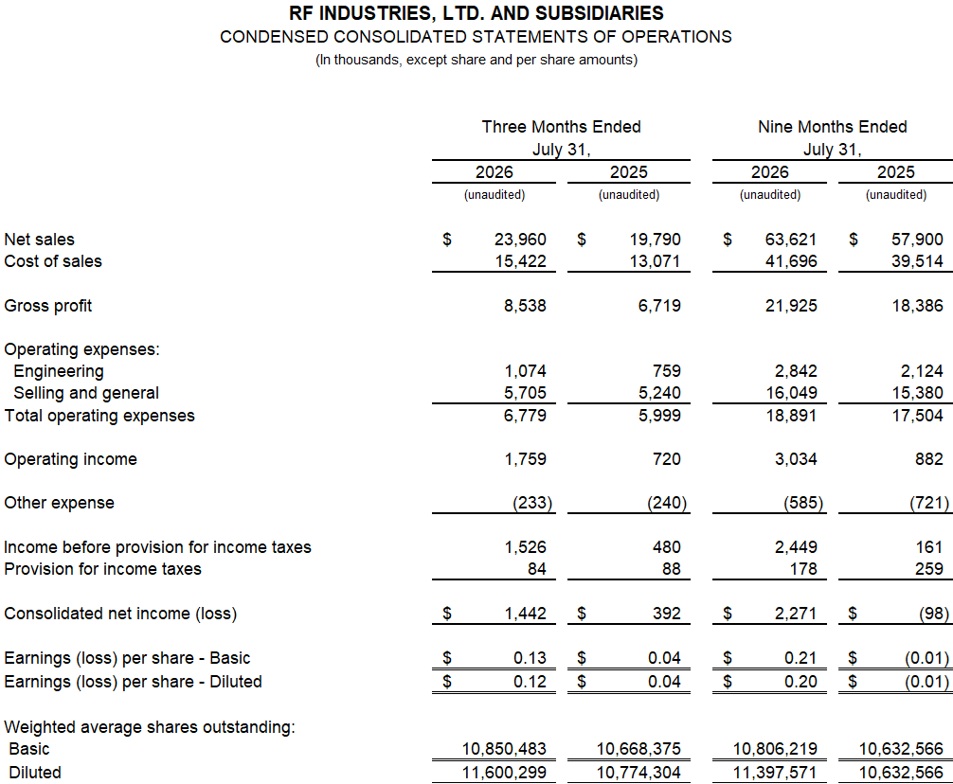
"The RFI team delivered another quarter of accelerating topline growth by converting stronger demand into expanding margins and dramatically higher profitability, as well as demonstrating the earnings power of the business as revenue scales above the $20 million quarterly run rate," said Robert Dawson, Chief Executive Officer of RF Industries. "Our third quarter results reflect the operating leverage story that we have discussed for the last couple of years, which is now yielding continued growth at every level of the income statement. Revenue grew 21% to a record $24 million while margins improved 160 basis points to 35.6%, operating income increased over 150% to $1.8 million and Adjusted EBITDA expanded 69% to $2.7 million year-over-year."
"Our steady margin expansion is a direct result of successfully executing a multi-year mix shift toward higher-value solutions, including our custom cabling and integrated systems offerings. These solutions have more engineering content, larger project scope, and engender stronger customer relationships than traditional component sales. Our strategy to offer higher-value, differentiated products and solutions with broad applications has also diversified our end markets considerably. RFI now serves fast growing markets such as aerospace, edge data centers, AI infrastructure, transportation, and public safety. While the wireless carrier ecosystem will always be very important to us, we have materially reduced our historical reliance on the cyclical carrier capex spending through product innovation, strategic diversification, and go-to-market execution," concluded Dawson.
Conference Call and Webcast
RF Industries will host a conference call and live webcast today, September 14, 2026, at 8:30 a.m. Eastern Time (5:30 a.m. Pacific Time) to discuss its fiscal third quarter 2026 financial results. To access the live call, dial 888-506-0062 (US and Canada) or 973-528-0011 (International) and give the participant access code 360409. A live audio webcast of the call will also be available on the Investor Relations section of RFI's website at www.rfindustries.com and will be archived for replay.
About RF Industries
Connecting the next generation with tomorrow's technology, RF Industries designs and manufactures a broad range of interconnect products across diversified, growing markets, including wireless/wireline telecom, data communications and industrial. The Company's products include high-performance components used in commercial applications such as RF connectors and adapters, RF passives including dividers, directional couplers and filters, coaxial cables, data cables, wire harnesses, fiber optic cables, custom cabling, energy-efficient cooling systems, and integrated small cell enclosures. The Company is headquartered in San Diego, California with additional operations in New York, Connecticut, and New Jersey. Please visit the RF Industries website at www.rfindustries.com.
Forward-Looking Statements
This press release contains forward-looking statements within the meaning of Section 27A of the Securities Act of 1933, as amended, and Section 21E of the Securities Exchange Act of 1934, as amended, with respect to future events. Forward-looking statements include, among others, statements concerning our expectations about profitability, revenues, industry trends, markets and any growth trajectory thereof, our ability to sustain our operating leverage, demand for our products, backlog, financial goals, growth opportunities and the expected benefits and desirability of our products, in each case which are subject to a number of factors that could cause actual results to differ materially. Factors that could cause or contribute to such differences include, but are not limited to: changes in the telecommunications industry and materialization and timing of expected network buildouts; timing and breadth of new products; our ability to realize increased sales; successfully integrating new products and teams; our ability to execute on our go-to-market strategies and channel models; our reliance on certain distributors and customers for a significant portion of anticipated revenues; the impact of existing and additional future tariffs imposed by U.S. and foreign nations; our ability to expand our OEM relationships; our ability to continue to deliver newly designed and custom fiber optic and cabling products to principal customers; our ability to maintain strong margins and diversify our customer base; our ability to initiate operating efficiencies, cost savings and expense reductions; our ability to address the changing needs of the market and capitalize on new market opportunities; our ability to add value to our customers' needs; the success of any product launches; our cash and liquidity needs; our ability to continue as a going concern; non-compliance with terms and covenants in our credit facility; and our ability to increase revenue, gross margins or obtain profitability in a timely manner. Further discussion of these and other potential risks and uncertainties may be found in the Company's public filings with the Securities and Exchange Commission (www.sec.gov) including our Annual Report on Form 10-K and Quarterly Reports on Form 10-Q. All forward-looking statements are based upon information available to the Company on the date they are published, and we undertake no obligation to publicly update or revise any forward-looking statements to reflect events or new information after the date of this release.
Note Regarding Use of Non-GAAP Financial Measures
To supplement our unaudited condensed financial statements presented in accordance with U.S. generally accepted accounting principles (GAAP), this earnings release and the accompanying tables and the related earnings conference call contain certain non-GAAP financial measures, including adjusted earnings before interest, taxes, depreciation, amortization (Adjusted EBITDA), non-GAAP net income (loss) and non-GAAP earnings (loss) per share, basic and diluted (non-GAAP EPS).
We believe these financial measures provide useful information to investors with which to analyze our operating trends and performance by excluding certain non-cash and other one-time expenses that we believe are not indicative of our operating results.
In computing Adjusted EBITDA, non-GAAP net income (loss) and non-GAAP EPS, we exclude stock-based compensation expense, which represents non-cash charges for the fair value of stock options and other non-cash awards granted to employees, non-cash and other one-time charges, severance, amortization expense and provision for income taxes. For Adjusted EBITDA, we also exclude depreciation and interest expense. Because of varying available valuation methodologies, subjective assumptions, and the variety of equity instruments that can impact a company's non-cash operating expenses, we believe that providing non-GAAP financial measures that exclude non-cash expense and non-recurring costs and expenses allows for meaningful comparisons between our core business operating results and those of other companies, as well as provides us with an important tool for financial and operational decision-making and for evaluating our own core business operating results over different periods of time.
Our Adjusted EBITDA, non-GAAP net income (loss) and non-GAAP EPS measures may not provide information that is directly comparable to that provided by other companies in our industry, as other companies in our industry may calculate non-GAAP financial results differently, particularly related to non-recurring, unusual items. Our Adjusted EBITDA, non-GAAP net income (loss) and non-GAAP EPS are not measurements of financial performance under GAAP and should not be considered as an alternative to operating or net income or as an indication of operating performance or any other measure of performance derived in accordance with GAAP. We do not consider these non-GAAP measures to be a substitute for, or superior to, the information provided by GAAP financial results. Non-GAAP financial measures are subject to limitations and should be read only in conjunction with the Company's consolidated financial statements prepared in accordance with GAAP. We believe that these non-GAAP measures have limitations in that they do not reflect all of the amounts associated with our GAAP results of operations. We compensate for the limitations of non-GAAP financial measures by relying upon GAAP results to gain a complete picture of our performance. A reconciliation of specific adjustments to GAAP results is provided in the last two tables at the end of this press release.
In addition, we have included order bookings and backlog in this earnings release. Bookings represent new orders that have been received inclusive of any modification or cancellation of previous orders. Backlog represents orders that have been received where revenue has not been recognized as of the specified date. We believe both Bookings and Backlog are indicators of future revenues that the Company expects to generate based on orders that management believes to be firm.
RF Industries Contact:
Peter Yin
SVP and CFO
(858) 549-6340
[email protected]
IR Contact:
Donni Case
Financial Profiles, Inc.
(310) 622-8224
[email protected]
SOURCE: RF Industries, Ltd.
View the original press release on ACCESS Newswire
G.George--TFWP