
Azarga Metals Announces Mineral Resource Estimate for the Marg Project, Central Yukon

VANCOUVER, BC / ACCESS Newswire / September 8, 2025 / AZARGA METALS CORP. ("Azarga Metals" or the "Company") (TSX-V:AZR) is pleased to report an independent Mineral Resource estimate prepared in accordance with National Instrument 43-101 Standard of Disclosures for Mineral Projects ("NI 43-101") for its high-grade, copper rich Volcanogenic Massive Sulfide ("V\MS") Marg project (the "MargProject") located in Central Yukon, Canada.
Highlights of the Marg Project Mineral Resource include:
2025 Mineral Resource at 0.5% copper equivalent[1] ("CuEq") cut-off of:
Category | Tonnage Mt | Cu % | Pb % | Zn % | Ag g/t | Au g/t | CuEq1 % | |
Indicated | 4.3 | 1.3 | 1.7 | 3.2 | 42 | 0.66 | 2.9 | |
Inferred | 10.0 | 1.0 | 1.3 | 2.6 | 33 | 0.54 | 2.3 | |
Significant opportunity to expand the scale of Marg Project with:
Marg Project extensions: The Marg deposit remains open to the east, west and down dip, indicating significant potential to expand the Mineral Resource.
Additional VMS deposits: Geophysical surveys, surface mapping and additional surface mineralization occurrences at the Jane zone, indicating considerable prospectivity for additional VMS mineralization outside of the Marg deposit but within the Marg property.
Gordon Tainton, President and CEO commented: "The results of the Marg Mineral Resource estimate are highly encouraging. Not only do they validate the Marg Project as a high-grade, copper rich VMS deposit, but the data review also highlights the significant potential to increase the size of the Mineral Resource with additional drilling and sampling. We truly believe the Marg Project has the potential to become a district scale asset. The deposit remains open to the east and the west, as well as at depth down dip. In addition, the Jane Zone, located west of the Marg deposit, indicates significant prospectivity for additional VMS mineralisation.
Further validating the district scale potential are the results of an induced polarization survey previously completed by the Company that identified an additional zone of interest north of the Marg deposit. With one fold hinge currently interpreted within the Marg deposit, there is also potential for a further synclinal hinge deeper in the sequence. This presents potential for higher grade and thicker zones that could be defined down dip of the Mineral Resource. These present key exploration targets within the Marg deposit.
The Mineral Resource is a key milestone for the Company and will form the basis for further geophysical & geotechnical exploration, including drilling. We look forward to advancing Marg with the core objective to generate long-term value for our stakeholders."
A Technical Report documenting the Mineral Resource will be filed on SEDAR+ (www.sedarplus.ca) and will also be available on the Company's website (www.azargametals.com). The following sections present a brief summary of the Mineral Resource documentation along with some further comments on exploration prospectivity.
Mineral Resource Update
The 2025 Mineral Resource builds upon the historic Mineral Resource model, extending the interpreted mineralised domain extent using a 0.5% CuEq cut-off grade and simplifying the structural model by removing the previous use of dual cut-offs.
Table 1 presents the Mineral Resource at the selected 0.5% CuEq cut-off and Table 2 presents further information at alternative cut-off thresholds.
Table 1 2025 Mineral Resource at 0.5% CuEq cut-off
Category | Tonnage Mt | Cu % | Pb % | Zn % | Ag g/t | Au g/t | CuEq % |
Indicated | 4.3 | 1.3 | 1.7 | 3.2 | 42 | 0.66 | 2.9 |
Inferred | 10.0 | 1.0 | 1.3 | 2.6 | 33 | 0.54 | 2.3 |
Copper Equivalence (CuEq) has been used for interpretation and reporting purposes since the deposit has five potentially economic elements of significance.
CuEq% is calculated as:
CuEq% = Cu% + 0.1·Pb% + 0.25·Zn% + 0.62·Au (g/t) + 0.007·Ag (g/t)
Metal price and recovery assumptions include:
Copper: US$9,100/t; 80% recovery, 96.5% payable
Lead: US$1,900/t; 50% recovery, 75% payable
Zinc: US$2,600/t; 80% recovery, 85% payable
Gold: US$3,000/oz; 50% recovery, 90% payable
Silver: US$32/oz; 50% recovery, 90% payable
Metal prices are based on rounded three month average metal prices at April 2025
Recovery and payability assumptions from the last metallurgical assessment in 2016
Previous economic assessments indicate that the Marg deposit has potential for both open pit and underground development. However, the selective sampling practices used historically, focused primarily on visually high-grade material that limit the confidence in assessing near-surface low-grade potential for open pit scenarios.
Metallurgical testwork suggests that the deposit is amenable to differential flotation, producing copper, lead, and zinc concentrates, with gold and silver reporting to the sulphide concentrates.
Table 2 Marg grade tonnages by variable copper equivalent cut-offs
Classification | Cut-off CuEq % | Mt | Cu % | Zn % | Pb % | Ag g/t | Density t/m3 |
Indicated | 0.00 | 4.3 | 1.3 | 3.2 | 1.7 | 42 | 3.5 |
0.25 | 4.3 | 1.3 | 3.2 | 1.7 | 42 | 3.5 | |
0.50 | 4.3 | 1.3 | 3.2 | 1.7 | 42 | 3.5 | |
0.75 | 4.3 | 1.3 | 3.2 | 1.7 | 42 | 3.5 | |
1.00 | 4.2 | 1.3 | 3.2 | 1.7 | 42 | 3.5 | |
1.50 | 3.8 | 1.4 | 3.4 | 1.8 | 44 | 3.6 | |
2.00 | 3.0 | 1.5 | 3.8 | 2.0 | 48 | 3.7 | |
2.50 | 2.5 | 1.7 | 4.1 | 2.2 | 51 | 3.7 | |
3.00 | 2.1 | 1.8 | 4.3 | 2.3 | 54 | 3.8 | |
Inferred | 0.00 | 10.2 | 1.0 | 2.6 | 1.3 | 32 | 3.4 |
0.25 | 10.1 | 1.0 | 2.6 | 1.3 | 32 | 3.4 | |
0.50 | 10.0 | 1.0 | 2.6 | 1.3 | 33 | 3.4 | |
0.75 | 9.8 | 1.0 | 2.7 | 1.3 | 33 | 3.4 | |
1.00 | 9.4 | 1.0 | 2.8 | 1.3 | 34 | 3.4 | |
1.50 | 7.8 | 1.1 | 3.0 | 1.5 | 37 | 3.5 | |
2.00 | 5.7 | 1.2 | 3.4 | 1.7 | 42 | 3.5 | |
2.50 | 3.9 | 1.4 | 3.8 | 1.9 | 47 | 3.6 | |
3.00 | 2.3 | 1.5 | 4.4 | 2.1 | 53 | 3.8 |
Previous Work
A historic Preliminary Economic Assessment was completed on the Marg Project in 2016 by a previous operator. Though the NI43-101 report was issued it is not publicly available on Sedar Plus as the previous operator was a private entity. The historic work outlined potential for both open pit development near surface and underground development target and is further discussed in the updated technical report.
Introduction
The Mineral Resource for the Marg Property, is prepared for Azarga Metals Corp. (AMC) by independent consultants at IMC Mining Pty Ltd (IMC) and is documented in the NI43-101 technical report. This builds upon previous studies, including the 2016 Preliminary Economic Assessment (PEA) and a 2015 JORC scoping study, both of which also involved IMC.
The Marg Property is a volcanogenic massive sulphide (VMS) deposit located in the Central Yukon, approximately 40 km east of Keno City. According to the property's claims history, Azarga acquired a 100% interest in the 400 mineral claims, which cover approximately 8,400 hectares, in July 2025 (Figure 1).
The deposit was first identified by the Geological Survey of Canada in 1965, with extensive exploration, including 119 diamond drill holes, conducted by various companies between 1965 and 2008. This historical work is considered to be of good quality and meets industry standards.
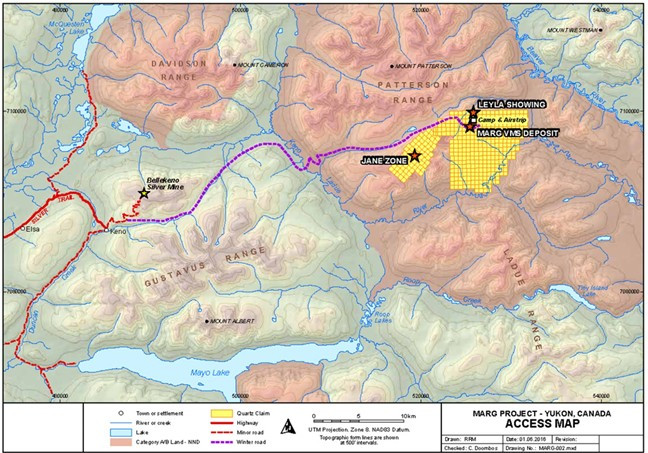
Figure 1 Marg mineral claim outline and deposit location
Deposit Geology
The Marg deposit is located towards the northwestern part of the Marg property and is hosted within a 12 km belt of felsic volcanic rocks belonging to the Devono-Mississippian Earn Group (Figure 2).
The Marg deposit indicates a complex structural history involving several phases of folding that has deformed the original massive sulphide layers into a series of sub-parallel lenses. These sulphide layers reach up to 23 metres in thickness within the core fold hinge and have been defined by drilling over a strike length of 1.4 km and a down-dip distance of 700 m (see Figure 3 and 4).
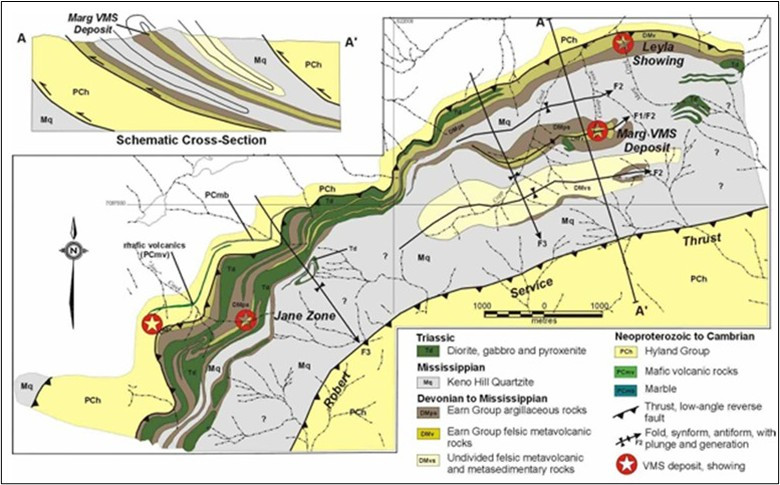
Figure 2 Local geological plan of the Marg property (northern claim area)
The Marg property includes some other surface mineralisation showings, such as the Jane Zone (Figure 2). Geophysical surveys and additional surface mineralisation occurrences indicates considerable area of prospective geology for additional VMS mineralization outside of the Marg deposit but within the Marg property.
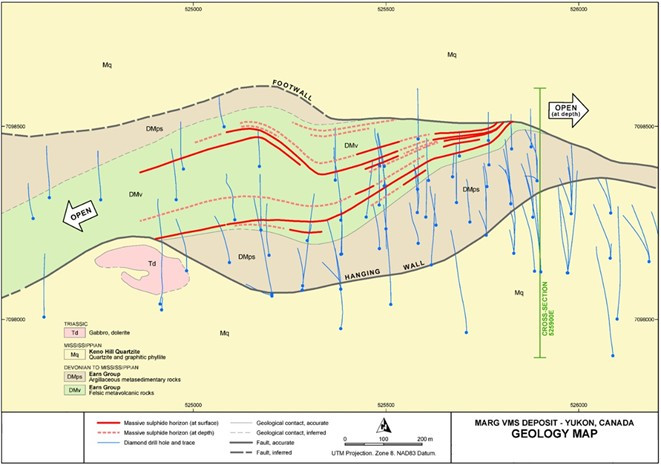
Figure 3 Marg schematic geology and mineralisation in plan view
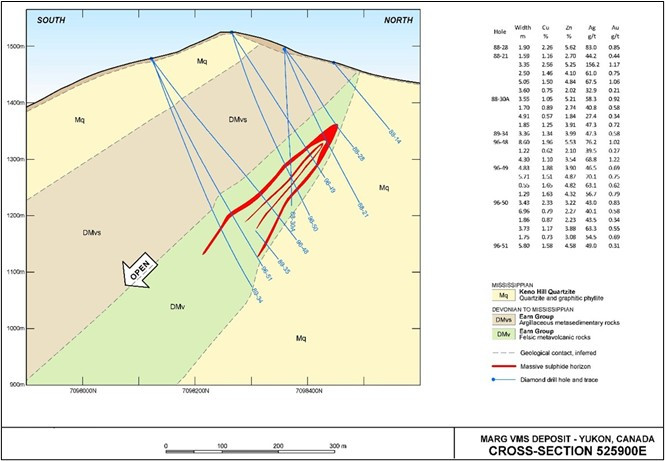
Figure 4 Marg schematic geology and mineralisation in cross section at 525900mE
The most recent geophysical work completed by the company included an induced polarization survey (Figure 5), which identified an additional zone of interest at the Marg Project. Zone A, lying to the north of Zone B (the current Mineral Resource), and is interpreted as the probable "up-dip", near surface mineralized Marg horizon.
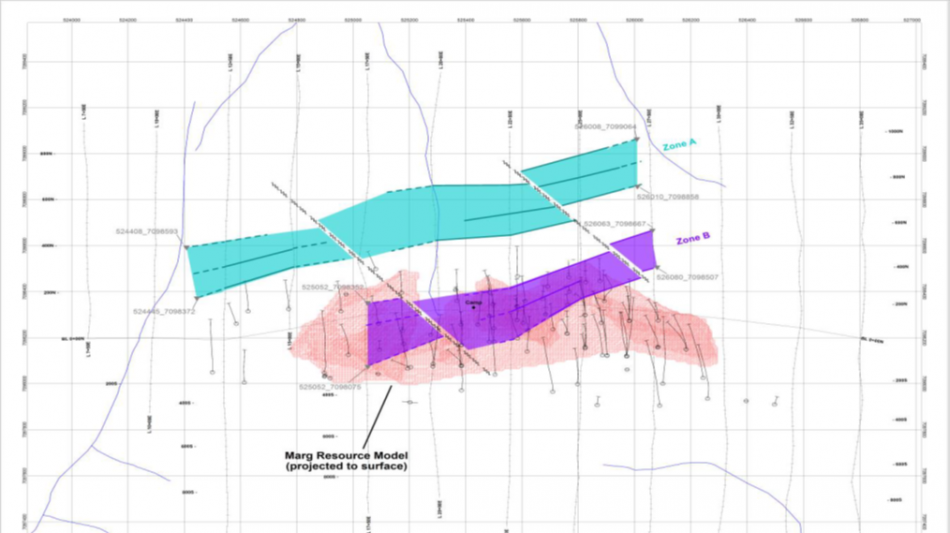
Figure 5 Marg deposit area induced polarization survey targets
Drilling
The Marg Property has been explored by nine diamond drilling programs in 1988, 1989, 1990, 1996, 1997, and 2005, 2006, 2007 and 2008 for a total of 119 completed drill holes. 115 of these holes for 33,620 m define the Marg deposit with mineralisation over a 1.4 km trend distance, a down dip distance of 700 m and across a stratigraphic thickness of approximately 100 m.
Data Verification
The four drilling programs completed in 2005, 2006, 2007 and 2008 included adequate QAQC programs with acceptable results. Earlier drilling and processes were adequately documented and statistically provided similar tenor results to later drilling.
Since the completion of drilling in 2008 there have been several NI 43-101 and JORC reports completed for Marg, each included data review, site inspections and verification. They include:
Copper Ridge 2011 NI 43-101 report
Redtail 2013 NI 43-101 report
MinQuest 2015 JORC Scoping Study
Revere Development Corporation 2016 PEA NI 43-101
This process has been revised for the current update. None of these reviews indicate significant issues and concluded the data is suitable for resource evaluation purposes.
Independent verification sampling program for 25 drill intervals was completed in 2013 and provided adequate repeatability.
For the current Mineral Resource technical report Ms Deborah James, P.Geo and Mr Gordon Tainton visited the Marg Property on June 20, 2025. They reviewed the reports, drill core, flew over the drill hole collars and noted visual corroboration of the drilling, drill orientation and mineralisation. Two samples were collected from two different mineralised intervals to confirm the tenor of mineralization. The samples are not duplicates. The samples were kept under the supervision of Ms James and delivered to the Bureau Veritas preparation lab facility in Whitehorse. The results support the tenor of grades expected despite some evidence of oxidation.
Estimation Method
The Mineral Resource is based on an interpretation of structural folded stacked arrangement VMS lenses. Interpretations were based on a 0.5% CuEq cut-off and a minimum 2 m downhole length. A block model was constructed to represent the interpretation with sizes suitable for underground or open pit assessed and grade as for Cu, Pb, Au, Ag and Zn were estimated using Ordinary Kriging.
An increase in the amount of Inferred and Indicated Mineral Resource has been realized in due to multiple factors.
The previous approach undertaken in 2015 and 2016 interpret both a high-grade zone >2% CuEq and an enclosing broad 0.5% CuEq. Simplifying the interpretation to a single 0.5% CuEq removed some excessive dilution and simplified the structural interpretation.
The previous broad low grade interpretations excluded many down dip extensions which are now incorporated.
Metal prices are now significantly higher than used in 2016 and more heavily weight Au, Ag and Cu for the copper equivalence calculation.
Mineral Resource Classification
Classification approach remains unchanged from 2016 and uses a pragmatic and repeatable approach. The blocks that were estimated in the first pass with 3 drill holes within a 90 m by 60 m search pattern were used as a guide to defining the area of consistent drill coverage suitable for Indicated Mineral Resource classification. This was applied, to only the eastern upper and eastern lower outer high grade zones that demonstrate continuity, by digitising in the extent of the area and applying it to blocks in the dominant domains (Figure 6).
The extension of the domains for the current estimate does include some areas where a wide drill spacing is present. Hence for Inferred Mineral Resource a minimum spacing from any drill holes was used to exclude a few minor internal widely drilled area from the Mineral Resource.
The Mineral Resource classification process has the effect of classifying:
Indicated Mineral Resource defined by areas with demonstrated continuity in the eastern outer limb zones where the drill spacing is roughly 80 m by 40 m within the plane of the mineralisation. The plan projected outline is displayed in Figure 1.
Inferred Mineral Resource includes domains that are interpreted and within 60 m from a drill hole.
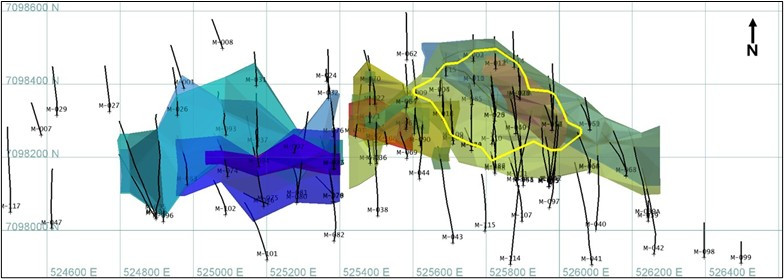
Figure 6 Plan view of domain wireframes and Indicated classification (yellow outline)
Exploration Potential
There is excellent potential for definition of additional VMS mineralisation.
At the Marg deposit there is exploration potential:
Resampling of selected existing drill core intervals for suspected mineralisation zones as well as low grade options in near surface drilling is planned to commence in September 2025. This may identify mineralisation overlooked during the original selective sampling of the drill core around visually obvious intervals.
There is potential to extend the current areas defined by drilling that remain open towards east, west and at depth down dip.
Within Marg there is one anticlinal fold hinge currently interpreted but there is potential for a further synclinal hinge deeper in the sequence. This presents potential for higher grade and thicker zones that could be defined down dip from existing drilling.
There is also potential for additional VMS deposits along the prospective geological horizon (Figure 2) that have been highlighted by the previous mapping and geophysical surveys. Most exciting is the recent induced polarisation target north of Marg deposit (Figure 5).
Previous operators conducted stream, soil and rock geochemical sampling and geological mapping in 1982, 1988, 1989 and 2007. Initial geological mapping revealed stratigraphic similarities to the Marg Zone and this was confirmed by property wide geological mapping in 2000. Soil sampling revealed a 600 m long, 50 to 100 m wide discontinuous but coincident lead-zinc-copper geochemical anomaly. A brief prospecting traverse in 1988 located small fragments of strongly oxidized, sulphide mineral bearing rock in coarse talus below a steep slope at the head of Jane Creek and within the above geochemically anomalous area. The best assay from this work was 0.29% Cu, 4.34% Pb, 5.14% Zn, 38.4 g/t Ag and 0.3 g/t Au. Further work is required to follow up on the drill results with additional mapping with rock chip sampling to identify potential sulphide bearing horizons. Additional drilling should target the results from the VTEM interpretation using the mapped favourable horizons as a guide now that the structural regime in this area is better understood.
Forward Plan
A first round of sampling of targeted drill core intervals previously unsampled is planned for the current summer season.
Future exploration and development work should include:
further diamond drilling to extend the Marg Mineral Resource.
additional metallurgical studies and an engineering scoping study should be carried out.
outside of the Marg deposit area, follow-up surveys and diamond drilling on known defined geochemical and geophysical target is required and recommended.
Qualified Person
IMC Mining Pty Ltd have prepared a Technical Report in collaboration with True Point Exploration. The Qualified Persons ("QPs"), as defined under NI 43-101, are John Horton BSc (Hons) FAusIMM (CP) and Debbie James, BSc. P.Geo. A Technical Report, authored by IMC Mining Pty Ltd ("IMC"), covering the Azarga Mineral Resource estimate, will be filed on SEDAR PLUS within 45 days of this news release and will also be available on the Company's website (www.azargametals.com). The effective date of the Mineral Resource is 29 August 2025. Mineral Resources are reported using the 2014 CIM Definition Standards and were estimated in accordance with the Canadian Institute of Mining, Metallurgy and Petroleum ("CIM") 2019 Best Practices Guidelines, as required by NI 43-101. Mineral Resources that are not Mineral Reserves do not have demonstrated economic viability. The estimate of Mineral Resources may be materially affected by environmental, permitting, legal, title, taxation, socio-political, marketing, or other relevant issues.
John Horton BSc (Hons) FAusIMM (CP), a Qualified Person as defined by NI 43-101, has reviewed and approved the exploration information disclosures contained in this news release.
Notes
Inferred Mineral Resource: Inferred Mineral Resources are resources that have not been defined in sufficient detail to be characterized as Measured or Indicated Mineral Resources. Mineral Resources have not had economic considerations applied to them and are therefore not characterized as Mineral Reserves.
Mineral Exploration/Exploration Target Area(s): Exploration targets and/or Exploration zones and/or Exploration areas are speculative and there is no certainty that any future work or evaluation will lead to the definition of a mineral resource.
Historical Data: This news release includes historical information that has been reviewed by Azarga's qualified person (QP). Azarga's review of the historical records and information reasonably substantiate the validity of the information presented in this news release; however, Azarga cannot directly verify the accuracy of the historical data, including (but not limited to) the procedures used for sample collection and analysis. Therefore, any conclusions or interpretations borne from use of this data should be considered too speculative to suggest that additional exploration will result in mineral resource delineation. Azarga encourages readers to exercise appropriate caution when evaluating these data and/or results.
About Azarga Metals
Azarga Metals is a mineral exploration and development company that owns 100% of the high-grade copper rich VMS Marg project located in Central Yukon, Canada.
AZARGA METALS CORP.
Gordon Tainton,
President and Chief Executive Officer
For further information please contact: Ben Meyer, at +1 604 536-2711 ext. 1 or visit www.azargametals.com. The address of the corporate office of Azarga Metals is Unit 1 - 15782 Marine Drive, White Rock, BC V4B 1E6, British Columbia, Canada.
Neither the TSX Venture Exchange nor its Regulation Services Provider (as that term is defined in the policies of the TSX Venture Exchange) accepts responsibility for the adequacy or accuracy of this release.
Cautionary Statement:
This news release contains forward-looking statements that are based on the Company's current expectations and estimates. Forward-looking statements are frequently characterized by words such as "expand", "expect", "demonstrate", "outcome", "continue" "potential", "improve", "discover", "priority", "significant", "opportunity", "compel" "continuity", "consistent", "expected", "relative", "comprehensive", "confident", "concept", "unlock", "identify", "modest", and variations of these words as well as other similar words or statements that certain events or conditions "could", "may", "would" or "will" occur. Such forward-looking statements involve known and unknown risks, uncertainties and other factors that could cause actual events or results to differ materially from estimated or anticipated events or results implied or expressed in such forward-looking statements. Such factors include, among others: the actual results of current and planned exploration activities; the potential to expand the Marg Mineral Resource; the interpretation of the Jane Zone as representing potential mineralized trends, and the potential for extensions to the Marg and other Zones; the interpretation that the Marg Project represents a larger mineralized system encompassing several target zones and the potential that such zones may represent additional Marg-like deposits; the ability to further improve confidence in the Marg Mineral Resource and the potential for, and timing of, a larger, updated Mineral Resource; the timing, results and conclusions of future economic evaluations; the improvement of the Marg Mineral Resource by future drilling; changes in project parameters as plans to continue to be refined; results of current and future metallurgical testing; possible variations in grades of mineralization and/or future actual recovery rates; accidents, labour disputes and other risks of the mining industry; the availability of sufficient funding on terms acceptable to the company to complete the planned work programs; delays in obtaining governmental approvals or financing; and fluctuations in metal prices. There may be other factors that cause actions, events or results not to be as anticipated, estimated or intended. Any forward-looking statement speaks only as of the date on which it is made and, except as may be required by applicable securities laws, the Company disclaims any intent or obligation to update any forward-looking statement, whether as a result of new information, future events or results or otherwise. Forward-looking statements are not guarantees of future performance and accordingly undue reliance should not be put on such statements due to the inherent uncertainty therein.
[1] CuEq is defined in the "Mineral Resource Update" section of this press release.
SOURCE: Azarga Metals Corp.
View the original press release on ACCESS Newswire
D.Ford--TFWP