China Auto Exports Surge as Industry Moves Toward Overseas Production

Chinese vehicle exports reached 6.41 million units through July while domestic output and sales fell, pushing manufacturers toward deeper localization abroad.
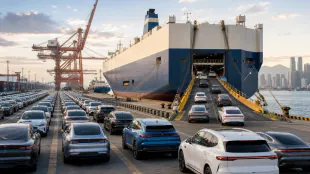
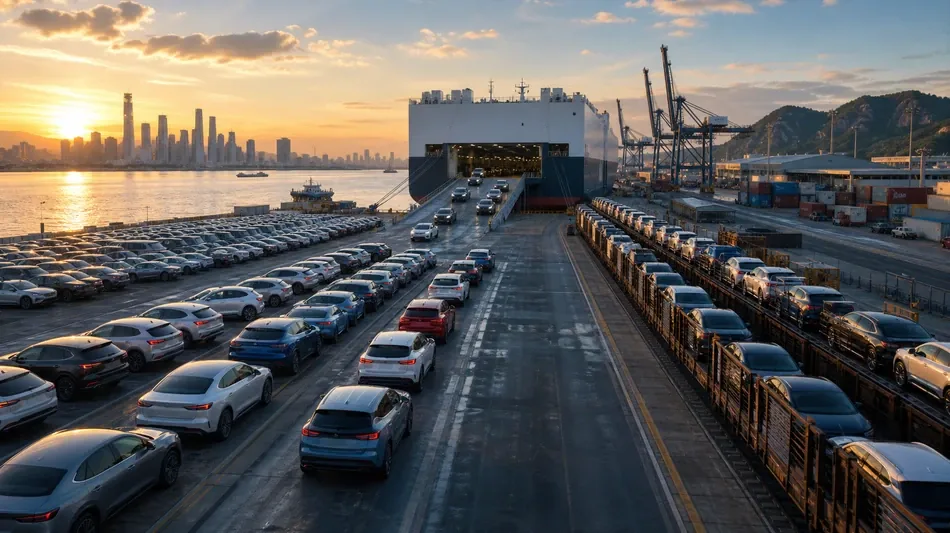
China’s vehicle exports climbed rapidly in 2026 even as its domestic market weakened. China Passenger Car Association data showed July shipments abroad of 1.09 million vehicles, 57 percent more than a year earlier. Exports for January through July reached 6.41 million, up 54 percent.
New-energy vehicles accounted for much of the increase. Seven-month NEV exports rose 72 percent to 2.96 million. In contrast, Ministry of Industry and Information Technology figures placed domestic first-half production at 14.993 million vehicles and sales at 15.017 million, declines of 4 percent and 4.1 percent respectively.
The export mix is changing. Battery-electric models represented 32 percent of July exports and plug-in hybrids 18 percent, while conventional internal-combustion vehicles fell to 35 percent. CPCA secretary-general Cui Dongshu said hybrids and plug-in hybrids were replacing pure electric cars as the main source of new growth because charging infrastructure differs across foreign markets.
Russia returned to first place among destinations in the first seven months, taking 542,900 vehicles, up 136 percent. Brazil ranked second at 427,700, an increase of 144 percent, and the United Kingdom was third at 320,500, up 91 percent. Australia and Belgium also grew strongly.
Some increases reflected temporary policy and comparison effects. Manufacturers accelerated Brazilian deliveries before a unified 35 percent tariff took effect on July 1, after which monthly shipments fell sharply. Russia’s result followed a weak 2025 base. Conflict also impeded deliveries to the Middle East.
Higher export volume has coincided with pressure on costs and margins. Lithium carbonate prices have risen since mid-2025 to an average above 140,000 yuan a metric ton, roughly 140 percent above the year’s low. AI demand has absorbed memory-chip capacity, leaving automotive-grade fulfillment below 50 percent and lifting prices for some high-end products by more than 300 percent. NIO chairman William Li identified memory as the industry’s largest 2026 cost pressure.
China Association of Automobile Manufacturers calculations based on national statistics put the sector’s first-half sales margin at 3.8 percent. Manufacturers are responding by moving beyond vehicle exports toward coordinated supply chains and local production.
Geely acquired a 34 percent interest in Ford’s Valencia plant in Spain for 221 million euros in July and formed a joint venture to manufacture NEVs. BYD said assembly at its Hungarian plant would begin in the fourth quarter. Its Brazilian factory moved from groundbreaking to production in 15 months and has annual capacity of 150,000 vehicles.
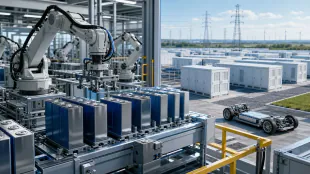
These projects illustrate a shift from shipping finished vehicles to placing manufacturing, technology and supplier relationships inside destination markets. Local plants can reduce exposure to tariffs and transport costs, but they also require companies to meet local labor, regulatory and sourcing expectations. The approach therefore commits more capital and management attention than conventional exports and makes overseas performance dependent on operations in several jurisdictions.
The strategy faces obstacles including weak brand premiums, a gap between sales volume and profit, and shallow local roots. Some destination countries also fear Chinese production will displace domestic industry. Industry participants argue that lasting localization requires helping suppliers and manufacturers in host countries strengthen their own capabilities, rather than simply hiring workers or buying components.
The domestic decline adds urgency to that transition. Export growth can absorb part of China’s available production, but a low industry margin means additional volume does not automatically produce healthy earnings. Rising battery-material and semiconductor costs can be difficult to pass to customers in competitive foreign markets, particularly while Chinese brands are still working to establish pricing power.
Powertrain choice will also vary by country. Fully electric vehicles are most practical where charging is widespread, while hybrids and plug-in hybrids can serve drivers in markets with limited public infrastructure. The July mix shows manufacturers adapting their export portfolios instead of relying exclusively on the battery-electric products that initially defined China’s international NEV expansion.
The concentration of recent growth in Russia and Brazil creates another risk. Brazil’s tariff deadline pulled future demand into earlier months, and Russia’s percentage increase was amplified by a weak comparison year. Sustained expansion will require broader demand across Europe, the Global South and other regions rather than repeated one-time gains tied to policy windows.
Cui said underserved Global South markets and high fuel prices support demand for Chinese smart and electrified vehicles. He projected exports could reach 12 million in 2026, compared with 8.324 million in 2025, if the international environment remains stable. The outcome will depend not only on volume but on whether manufacturers can build profitable operations, recognized brands and durable local supply networks.
S.Jordan--TFWP